Network Status
Nothing flagged at the moment
A hand-kept read on the platform. Anything we know to be broken is posted here, and a fault you meet that is missing gets listed the moment you report it.
No incidents recorded
Not one core service is carrying a flag at present. Since a person keeps this board rather than a monitor, a fault you can see and we cannot is precisely the sort worth reporting to us.
- Running
Web Hosting
The nodes holding shared, WordPress and business accounts
- Running
VPS
The provisioning API and every KVM instance
- Running
Email
Messages travelling into and out of your inboxes
- Running
Control Panel
cPanel, plus the client area and billing screens
- Running
Network
DNS, core routing and the datacentre uplinks
Every entry on this status board is written and updated by hand. Seen a fault that is missing above? Tell our support team and somebody will get onto it at once.
5
Core services tracked here
By hand
How this board gets updated
99.9%
The uptime we aim at
Any hour
Hours for reporting a fault
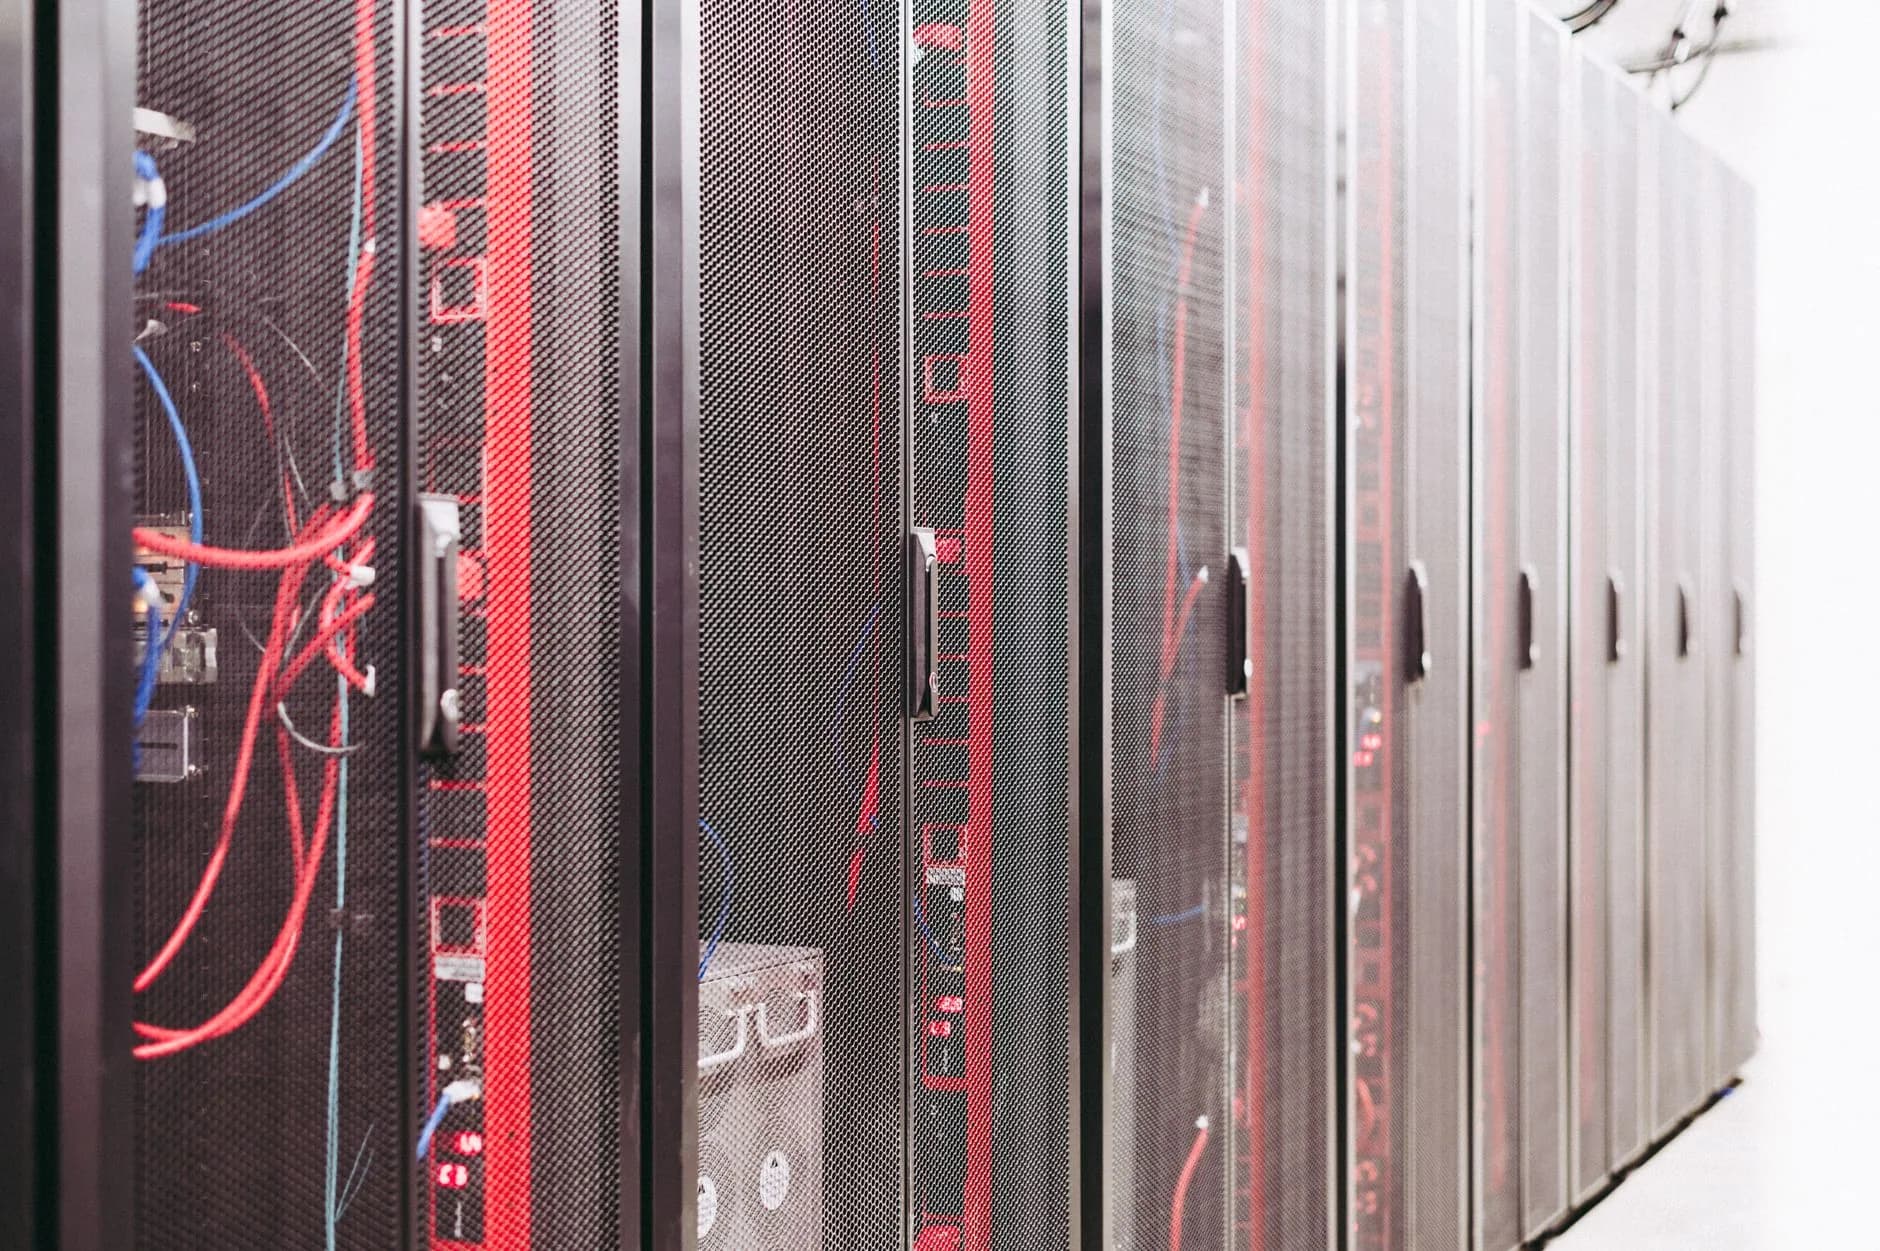
Behind the Board
Built to keep going
Hardened datacentres hold the platform, with standby power, standby cooling and standby network paths, which is why one failure rarely travels anywhere near your site. Faults down at that layer get flagged to us by the platform beneath, and from there we post them onto this board.
- Standby power and cooling on hand
- Several upstream network routes
- NVMe storage with copies behind it
- Platform-level faults flagged to us automatically
How It Works
A status board that tells the truth
Two roads a fault travels
The platform underneath flags hardware and network faults on its own, and customers bring us everything else. Whichever reaches us first, a person is the one who updates this board.
Redundancy already wired in
Power feeds, network routes and storage are each duplicated, so one failed component rarely has to reach you at all.
The board tells the truth
What this board shows is what we know right now. A rough hour never gets buried simply to hold a row green, and if a row looks stale to you, that is worth telling us about.
Monitored
What we watch
The parts of the platform this board covers. A fault in any of them belongs on this board, so flag whatever you meet that is not here.
- Servers and nodes answering
- Mail moving out, and the queue depth
- Control panel and sign-in availability
- Network circuits and power feeds within the facility itself
- DNS resolution and propagation
- SSL certificates issuing on time
- The nightly copy jobs completing
- The API that provisions and deploys accounts

Spotted a Problem?
Real engineers, ready to move
A problem is not always a platform outage. Often enough it turns out to be a DNS record still catching up, or a certificate that is due for reissue. Whichever it proves to be, support will help you track it down, put it right, and keep you posted along the way.
- Tickets and email, around the clock
- People, never canned replies
- Straight updates while we work
- Help isolating account-level faults
Hit A Snag?
Three fast moves towards a fix
- 1
Scan this board
Each core service is listed with its current state. Faults on our side land here before anywhere else.
- 2
Check your control panel
Log in and rule out a one-off affecting a single site, one mailbox or a DNS record you could fix yourself.
- 3
Message support
No further forward? Open a ticket describing precisely what is in front of you, and the team starts digging while keeping you posted.
Peace Of Mind
Reliability designed in, never bolted on
99.9% uptime, the target
Each plan here is built to a 99.9% uptime target, and watched against it.
Guarded and copied
Free SSL, filtering at network level and copies taken regularly keep your data safe and within reach.
Support that picks up
Genuine help at any hour of the day means somebody is there the second you ask.
FAQ
How this board works
What does an all-green board actually mean?
It means nothing is flagged against any core piece: web hosting, VPS, mail, the control panel, the network. What sits there is what we currently know, typed in by a person rather than produced by a probe, so read it as 'nothing reported' and not as a live measurement. The instant a service drops and word gets to us, its row says as much.
How current is what I am looking at?
A person keeps it current, not a monitor. The moment a fault reaches us, from the platform below or from a customer, the affected row is changed. So the board can lag a fault by however long it takes somebody to report the thing, which is precisely why reporting one speeds matters up for everybody.
Everything on the board shows green, yet my site is down. Why?
That normally points at something local to your account rather than a platform outage. A DNS change still propagating, a certificate that has lapsed, a plugin conflict, or a resource limit you have run into. Begin in your control panel, and if nothing there accounts for it, write to support and we will chase it down alongside you.
Is uptime guaranteed?
The target is 99.9%, and our terms hand you a pro-rated credit for any month that falls short because of a fault on our side. Ask, and it gets applied. Describing it as a contractual SLA is something we avoid on purpose. Want an independent record? Aim a free external monitor at your own name, and then you hold a measurement instead of our word for it.
Something has gone wrong and the board says nothing about it. Where do I report that?
Send support your name, which service is affected, and exactly what you are seeing on screen. Because this board runs on human updates, customer reports are one of only two roads a fault can travel to reach it. You are not bothering anybody. You may be telling us something that has not reached the board yet.
Seen something we have not?
If things look wrong from your side while this board still reads green, tell us — the team will get on it.
Message Support